Know what's happening across your entire nonprofit as it happens
Turn scattered information into clear reporting with live dashboards, automated board reports, and reports delivered when your team needs them.
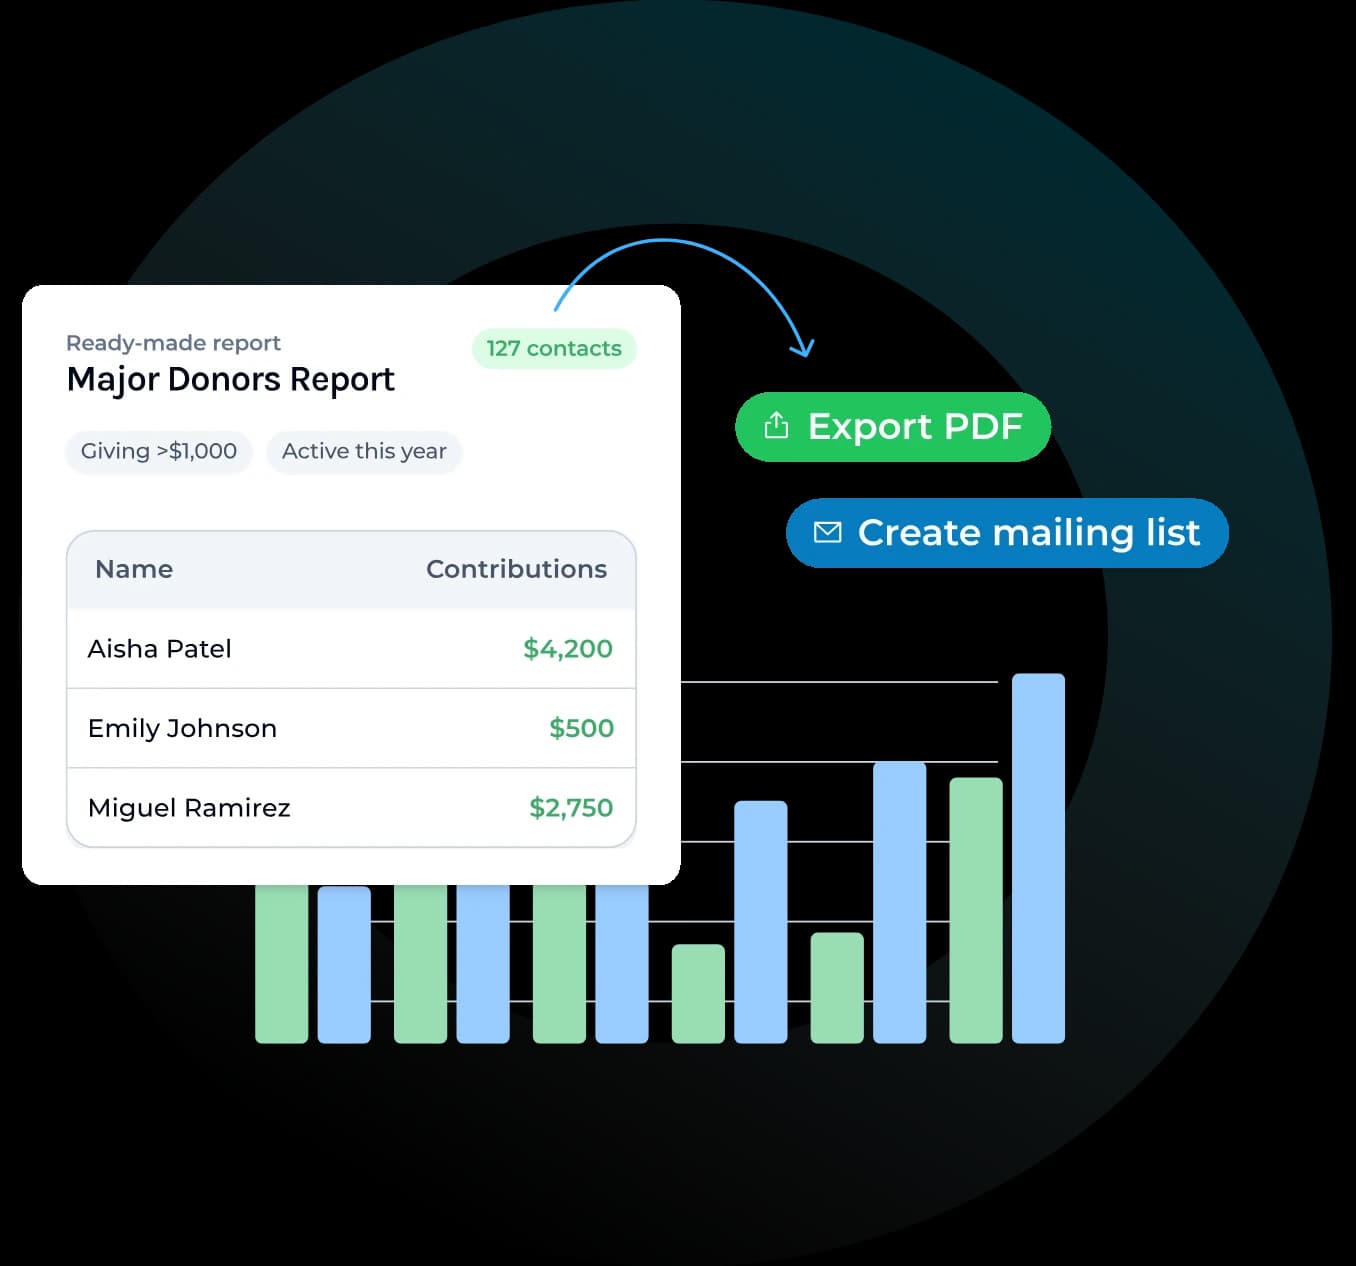
Live dashboards
Track fundraising, grants, donors, programs, and key activity as it happens.
Fundraising insights
Understand giving patterns, donor engagement, and campaign results.
Grant pipeline tracking
Keep grant opportunities, deadlines, and forecasts organized.
Impact reporting
Turn program data into reports your team and board can actually use.
From live data to board-ready reports automatically
Board reports shouldn't take days to prepare. SAPu pulls live data from across your organization, organizes it automatically, and delivers reports your leadership team can actually use.
Connect your data
SAPu pulls from your grant pipeline, donor CRM, fundraising campaigns, and program records automatically. No manual imports or spreadsheet updates.
Configure your reports
Review giving history, 990 filings, foundation profiles, and funding patterns.
SAPu compiles & writes
On schedule, SAPu compiles live data, generates plain-language summaries, flags trends and action items, and formats the report for delivery.
Delivered automatically
Board members receive a clean, readable report by email. Leadership gets the same data in their dashboard. No last-minute assembly required.
Connect your data
SAPu pulls from your grant pipeline, donor CRM, fundraising campaigns, and program records automatically. No manual imports or spreadsheet updates.
SAPu compiles & writes
On schedule, SAPu compiles live data, generates plain-language summaries, flags trends and action items, and formats the report for delivery.
Configure your reports
Review giving history, 990 filings, foundation profiles, and funding patterns.
Delivered automatically
Board members receive a clean, readable report by email. Leadership gets the same data in their dashboard. No last-minute assembly required.
From live data to board-ready reports
Bring fundraising, grants, donors, and program data together in one place. SAPu keeps reporting connected to live information so your team spends less time compiling updates and more time acting on them.
One source of truth
Every report pulls from the same connected data, helping your team work from a shared view instead of multiple spreadsheets.
Reports that write themselves
SAPu compiles live information into clear summaries, reducing manual reporting and repetitive administrative work.
Flexible reporting views
Start with built-in reports or create your own. Save filters, reuse views, and build reports around the questions your team needs answered.
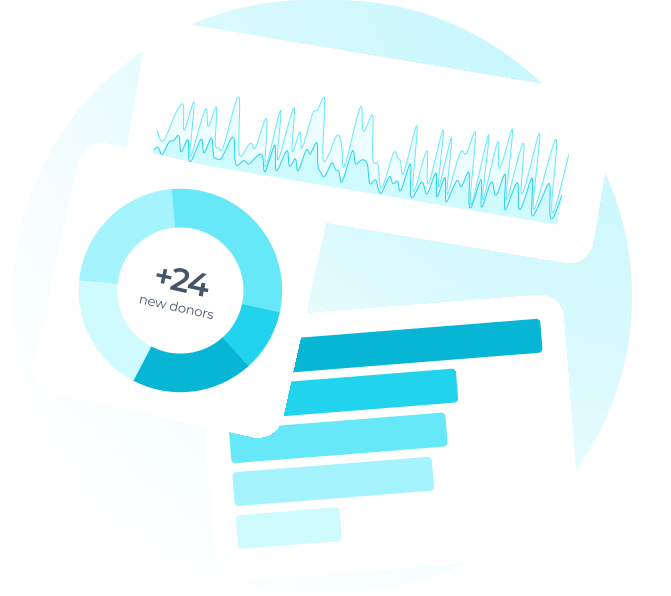
Example reports & dashboards
Grant pipeline report
Fundraising report
Donor report
Program & impact report
Board report (monthly)
Leadership dashboard

See what your reporting process could look like
Stop chasing spreadsheets and last-minute updates. Bring fundraising, grants, donors, and program data together in one connected reporting system.